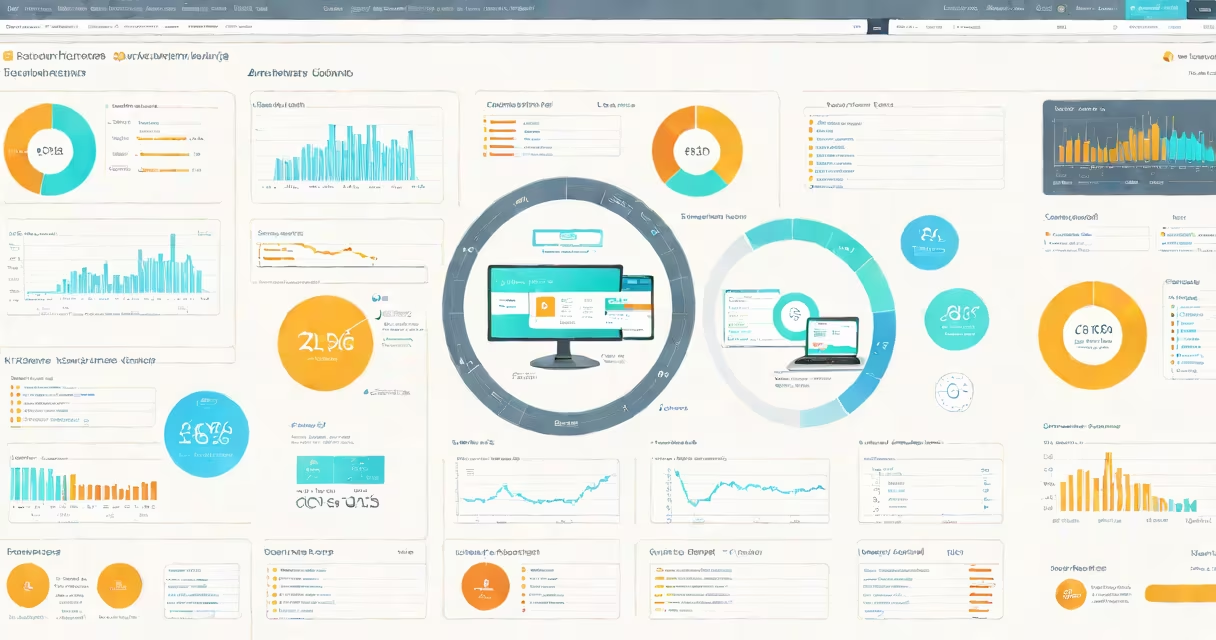
Application performance monitoring solutions are software systems that continuously collect, analyze, and report on the operational health of applications in production environments. They measure response times, track error rates, monitor resource usage, and correlate performance data across services to identify issues before users notice them.
These tools run in real time, gathering data from servers, databases, APIs, and client-side interactions. They use agents installed on infrastructure or libraries embedded in code to capture telemetry such as latency, throughput, and error counts. When thresholds are breached-like a 90th percentile response time exceeding 2 seconds-the system triggers alerts or visualizes anomalies on dashboards.
For example, a retail e-commerce platform using application performance monitoring solutions detected a spike in checkout page load times during a holiday sale. The tool traced the delay to a third-party payment gateway API timeout, which was then escalated to the vendor. Without this visibility, the issue could have caused lost sales and customer frustration.
APM solutions operate through a layered architecture. At the base, instrumentation collects data via agents or SDKs integrated into the application code. These agents log function calls, database queries, HTTP requests, and exceptions. Data flows into a central collector, where it's normalized and stored for analysis.
The core processing layer applies algorithms to detect patterns. For instance, a sudden increase in 5xx error codes across multiple instances signals a service failure. Correlation engines link events across microservices, helping teams trace a problem from frontend user actions to backend database locks.
Alerting and visualization occur at the top layer. Teams receive notifications via email, Slack, or PagerDuty when thresholds are exceeded. Dashboards display heat maps of response times, error rate trends, and service dependency graphs. This enables rapid triage during incidents.
APM tools fall into three categories based on focus and deployment model:
| Type | Focus | Deployment | Use Case |
|---|---|---|---|
| Full-stack APM | End-to-end transaction tracing across web, mobile, backend, and database layers | Cloud-hosted or self-managed | Enterprise applications with complex workflows |
| Backend-focused APM | Server-side performance: CPU, memory, disk I/O, database queries | Agent-based on VMs or containers | API-heavy services and batch processing systems |
| Client-side APM | User-facing performance: page load time, JavaScript errors, network delays | Browser scripts or mobile SDKs | Web apps and mobile apps with high user interaction |
A common misconception is that APM tools only monitor uptime. In reality, they measure user experience. A 2023 report from Gartner noted that 68% of application outages stem from degraded performance, not complete failures. APM solutions catch these degradation events early-before they escalate into downtime.
Many assume APM tools are interchangeable with basic server monitoring. But while tools like Nagios or Prometheus track system-level metrics (CPU, disk space), they don't understand application logic. An APM solution sees that a login endpoint takes 4.2 seconds under load-not just that the server is running at 80% CPU.
Another mistake is equating APM with logging. Logs record discrete events ("User failed to authenticate"), but APM correlates those events into a timeline of behavior. For example, a spike in authentication failures may appear in logs, but APM shows that the underlying cause was a database connection pool exhaustion-revealing the root issue.
Some organizations deploy APM only after an incident occurs. That's too late. The most effective teams integrate APM during development and testing. At a financial services firm I worked with, we instrumented their trading platform during CI/CD pipelines. Performance regressions were caught before release, reducing post-deployment incidents by 73% over six months.
Application performance monitoring solutions reduce mean time to detection (MTTD) and mean time to resolution (MTTR). According to a 2022 survey by Dynatrace, teams using APM reduced MTTR by an average of 52% compared to those relying on manual checks.
They also support business outcomes. A 100ms increase in page load time can reduce conversion rates by up to 7%, according to research from Akamai. APM tools help maintain optimal performance, directly impacting revenue.
For compliance, APM provides audit trails. Financial institutions use APM to verify that transaction processing meets SLAs. Healthcare providers monitor patient portal response times to ensure timely access to records.
When choosing a solution, consider data retention policies, integration capabilities, and cost per transaction. Some tools charge based on data volume, others on the number of monitored services. Always test with a subset of your environment first.
Application performance monitoring solutions are not optional in modern software delivery. They are foundational to reliability, user satisfaction, and operational efficiency. Their role extends beyond troubleshooting-they enable proactive optimization, continuous improvement, and measurable business value.