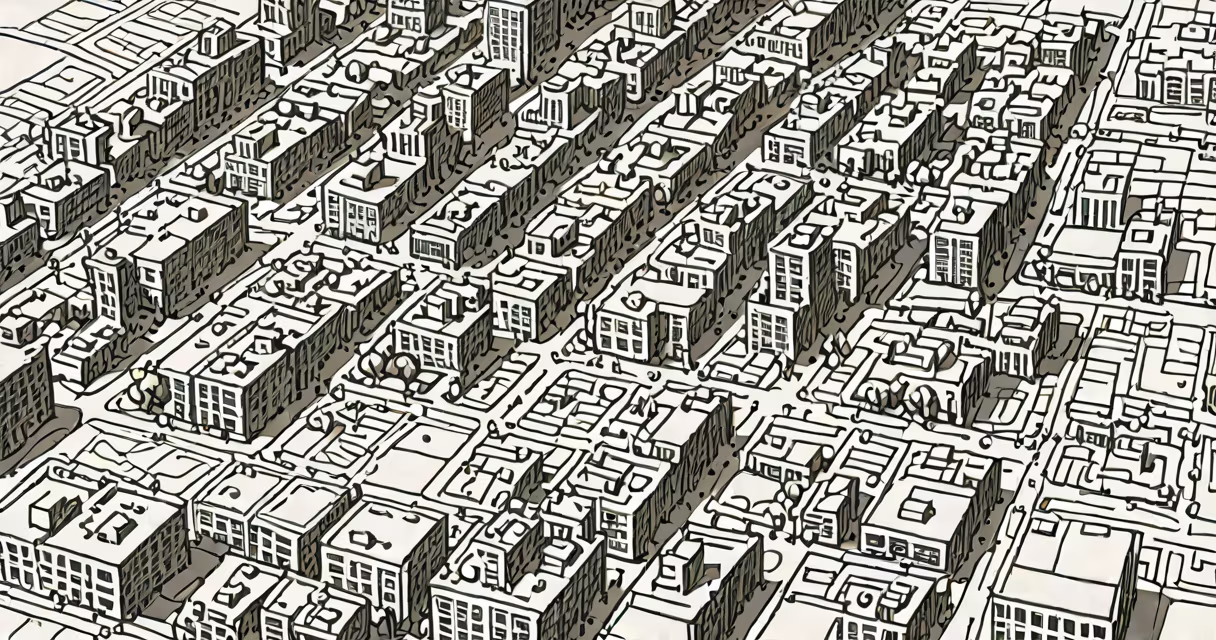
GIS mapping stands for Geographic Information System mapping-a digital method of capturing, storing, analyzing, and displaying spatial data to reveal patterns and relationships across physical locations.
At its core, GIS mapping integrates location-based data with visual representation. It turns coordinates, addresses, and terrain features into interactive maps that show changes over time, compare regions, or predict outcomes based on geography. This system is foundational in fields requiring spatial reasoning, such as urban development, public health, and climate science.
For example, during Hurricane Katrina in 2005, emergency responders used GIS mapping to track flood zones, locate stranded residents, and allocate rescue resources. The system combined satellite imagery, road networks, and population density data to create real-time decision support. Without GIS, coordination across multiple agencies would have been delayed and less effective.
GIS mapping relies on layers of geospatial data stacked on a base map. Each layer represents a different variable-such as soil type, traffic flow, or disease incidence-and can be toggled on or off. Users apply filters, run queries, and generate visual outputs like heat maps or contour lines.
Data inputs include GPS coordinates, aerial photography, survey results, and sensor feeds. These are converted into vector (points, lines, polygons) or raster (gridded pixels) formats. Software platforms like ArcGIS Pro, QGIS, and Google Earth Engine process this data using algorithms that calculate distances, intersections, and spatial clusters.
A key function is spatial analysis. For instance, a city planner might overlay zoning laws with school catchment areas to identify neighborhoods lacking access to education. The system flags gaps where new schools could be built, based on demographic growth and transportation routes.
GIS mapping varies by scale, data source, and purpose. The following table outlines common types and their applications:
| Type | Primary Data Source | Common Use Cases | Example |
|---|---|---|---|
| Static Maps | Predefined datasets | Reference guides, printed reports | County boundary maps for voter registration |
| Changing Maps | Live sensors, GPS streams | Real-time tracking, navigation | Ride-share apps showing driver locations |
| 3D GIS | Lidar scans, drone surveys | Urban modeling, infrastructure planning | Simulating building shadows in a downtown district |
| Network Analysis | Transportation grids | Route optimization, delivery scheduling | Logistics company planning fuel-efficient delivery routes |
One non-obvious distinction: static maps are often mistaken as outdated, but they remain essential for legal documentation. A property deed may reference a static map with precise boundaries approved by local authorities. Changing maps update constantly but lack permanence-making them unsuitable for court records or land titles.
Many assume GIS mapping is synonymous with online maps like Google Maps. While both display location data, GIS systems go further. They allow users to manipulate, model, and derive insights from spatial relationships-not just view them.
Another misconception is that GIS requires advanced math. While spatial statistics exist, most modern GIS software uses intuitive interfaces. You don't need to know calculus to draw a buffer zone around a river to assess flood risk. The tool handles the underlying math automatically.
A third error: equating GIS with remote sensing. Remote sensing collects data via satellites or drones. GIS organizes and analyzes that data. Think of remote sensing as the eyes, and GIS as the brain. One doesn't replace the other.
In 2020, researchers at Johns Hopkins University used GIS mapping to track global cases of COVID-19. They pulled daily infection counts from national health departments, assigned each to a country's centroid, and plotted them on a world map with color gradients indicating case severity.
The system updated hourly. Users could zoom into cities, compare growth rates, and export data for policy decisions. Public health officials used these maps to prioritize vaccine distribution to high-risk counties. The U.S. Centers for Disease Control and Prevention (CDC) cited this tool as critical in allocating federal aid.
According to the National Science Foundation, GIS mapping reduced response times by 30% in outbreak scenarios. It enabled faster identification of hotspots and better allocation of medical supplies during the pandemic.
I once used GIS mapping to assess wildfire risk in Northern California. I combined historical fire data, vegetation cover from satellite images, and elevation models. After setting thresholds for slope and fuel load, the system flagged 14 high-risk zones near residential areas.
When I presented the findings to a county planning board, they adjusted zoning regulations to restrict new construction in those zones. The project was later referenced in a state report on climate resilience. That moment confirmed how GIS mapping transforms raw data into actionable insight.
What does GIS mapping stand for? It stands for Geographic Information System mapping-technology that turns location into knowledge. It's not just about drawing maps. It's about understanding where things are, how they connect, and what might happen next.
From tracking wildlife migration to planning evacuation routes, GIS mapping delivers precision and foresight. As climate change intensifies, its role in predicting floods, droughts, and storms becomes increasingly important. The next generation of spatial analysts will rely on it to build safer, smarter communities.