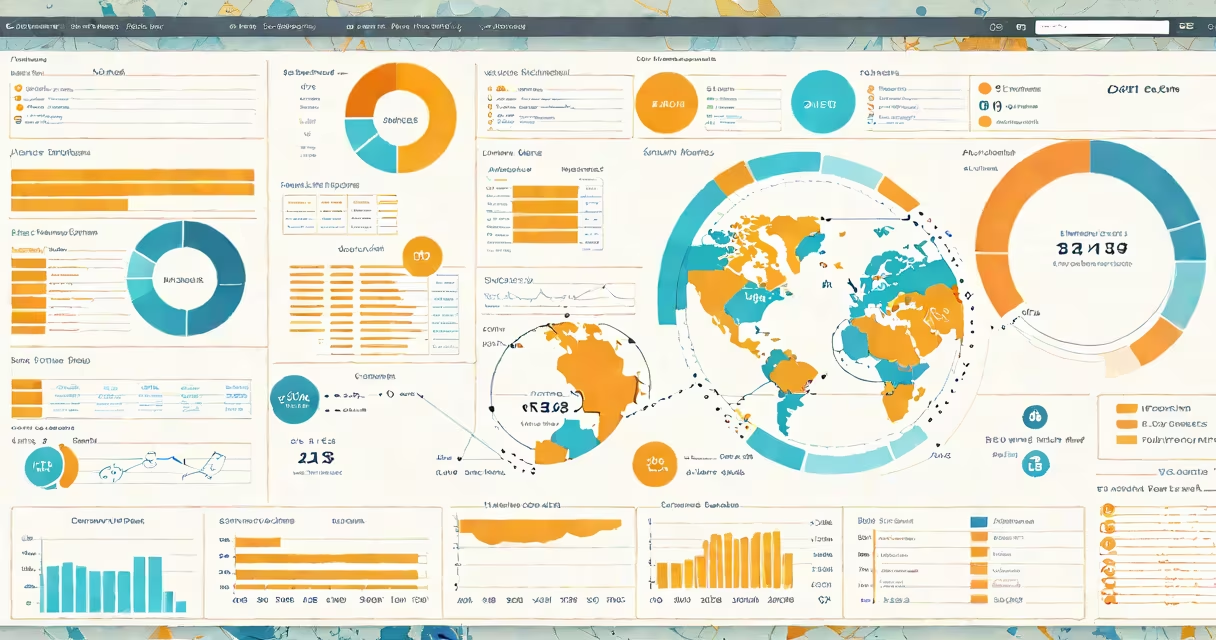
Embedded business intelligence integrates real-time data analysis and visual reporting directly into enterprise applications like CRM, ERP, or custom workflows, enabling users to act on insights without leaving their primary tool.
This approach places analytics where work happens. Instead of exporting data to a separate BI platform, users see performance dashboards, trend alerts, and predictive recommendations inside the software they use daily. For example, a sales rep in Salesforce views a real-time pipeline forecast and customer churn risk score without opening a separate analytics dashboard.
Unlike standalone BI tools that require users to switch contexts, embedded BI keeps decision-making continuous and contextual. It reduces delays, minimizes errors from manual data transfer, and increases adoption because insights appear naturally within existing tasks.
At its core, embedded business intelligence uses APIs and data connectors to pull live or near-live data from databases, data warehouses, or cloud services. This data flows into pre-built visualization components-charts, heat maps, tables-that render inside the host application's UI.
The process begins with defining key performance indicators (KPIs) relevant to a specific role or workflow. A marketing team might track click-through rates, conversion funnels, and campaign ROI directly in their email automation tool. The system pulls data from Google Analytics and Mailchimp via API, processes it through a lightweight analytics engine, and displays results in a compact widget on the campaign editor screen.
Modern embedded BI platforms like Looker Studio, Power BI Embedded, and Tableau Server offer SDKs and embeddable widgets. These allow developers to integrate analytics features into web or mobile apps using JavaScript or REST endpoints. Security is enforced through role-based access control, ensuring users only see data they're authorized to view.
Embedded BI consists of four foundational layers:
There are two common deployment models:
| Type | Description | Use Case Example |
|---|---|---|
| Self-Hosted Embed | Analytics components run on the customer's infrastructure. Full control over data and security. | A financial institution embedding credit risk models in its loan approval portal. |
| SaaS-Based Embed | Analytics hosted by a third-party provider. Lower setup cost, automatic updates. | An e-commerce platform using a cloud BI service to show inventory turnover rates in its warehouse management system. |
Some systems also support changing filtering-users can adjust date ranges, regions, or product categories directly in the embedded widget, which triggers a new data fetch and refreshes the visuals instantly.
Industries with high-volume transactional systems benefit most from embedded BI. Retailers embed demand forecasting tools in their inventory planning modules. Healthcare providers display patient readmission risks in electronic health record (EHR) interfaces. Logistics firms show delivery delay predictions in route optimization software.
According to Gartner, by 2025, 70% of new enterprise applications will include embedded analytics, up from 30% in 2020. This growth reflects a shift toward "analytics by default" in software design.
A real-world example: a regional bank integrated embedded BI into its core banking platform. Loan officers now see automated creditworthiness scores, collateral valuation estimates, and compliance flags during loan application processing. Internal testing showed a 22% reduction in approval cycle time and a 15% drop in default rates over six months.
Another advantage is reduced training overhead. When analytics appear in familiar workflows, users don't need to learn a separate dashboard interface. A study by Forrester Research found that teams using embedded BI reported 38% higher engagement with data compared to those relying on standalone reports.
Embedded business intelligence is not the same as reporting. Reporting typically involves scheduled exports of static data summaries. Embedded BI delivers changing, interactive insights tied to user actions and real-time data streams.
It's also not synonymous with artificial intelligence. While many embedded BI tools incorporate AI-driven features-like anomaly detection or forecast suggestions-the core function remains data visualization and context-aware insight delivery. AI enhances the output, but doesn't define the model.
A key distinction often missed: embedded BI requires close collaboration between data engineers, UX designers, and business analysts. Poorly designed widgets can clutter interfaces or misrepresent data. A well-placed chart showing monthly revenue trends in a sales dashboard improves clarity. A poorly sized, unlabelled graph may confuse users and erode trust.
One non-obvious fact: embedded BI can reduce data silos. When analytics are built into operational systems, data flows continuously between departments. Marketing sees real-time sales conversions. Finance gets immediate feedback on campaign spend. This cross-functional visibility supports faster, coordinated decisions.
Consider a mid-sized SaaS company using HubSpot for customer relationship management. They added embedded BI to track customer onboarding progress. The system pulls data from HubSpot's CRM, Stripe for billing, and Intercom for support interactions.
Inside the onboarding workflow, a manager sees a dashboard showing:
When a user stalls at step three, the system triggers a notification to the account manager. The manager reviews the embedded report, identifies the bottleneck (e.g., unclear instructions), and adjusts the onboarding flow. Over three months, the company reduced onboarding dropout by 31% and increased month-one retention by 27%.
This implementation required integrating three data sources, building a lightweight analytics engine, and designing a clean UI component. The result was a smooth addition to the existing platform-no new login, no context switching.