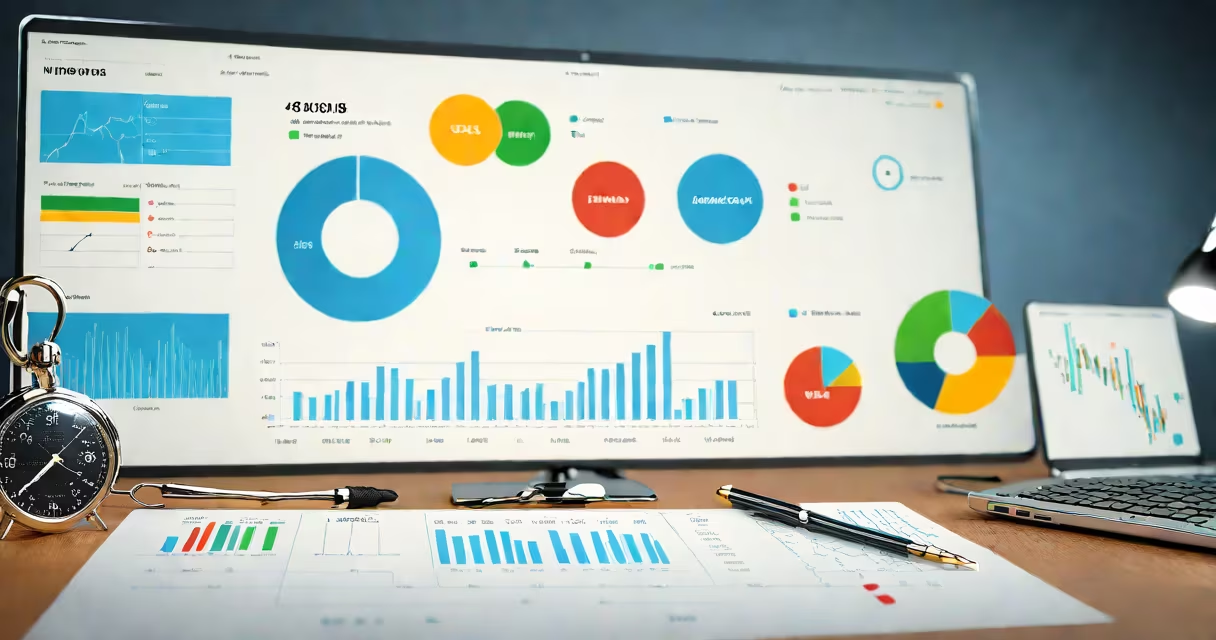
Analytic tools are software applications designed to collect, process, and interpret data to identify trends, measure performance, and support informed decision-making. They change raw data into visual insights such as charts, reports, and dashboards, enabling users to detect patterns and act on findings.
These tools are central to operations in finance, marketing, supply chain management, and healthcare. They range from basic spreadsheet functions to advanced AI-powered platforms capable of forecasting outcomes based on historical inputs. Their core purpose is turning data into actionable intelligence.
For example, a retail company uses analytic tools to track daily sales across regions. By analyzing customer purchase frequency and product returns, the team identifies which items sell best during holidays and adjusts inventory accordingly. This reduces overstock and improves cash flow.
Analytic tools begin by ingesting data from multiple sources-databases, APIs, spreadsheets, or IoT sensors. They clean and normalize the data, removing duplicates or errors that could distort results. Once structured, the tool applies algorithms to analyze relationships, calculate metrics, and generate visual outputs.
Modern tools often include machine learning models that detect anomalies or predict future behavior. For instance, a logistics firm uses an analytic tool to monitor delivery times. The system flags routes with consistent delays and suggests alternative paths based on traffic patterns and weather data.
Processing speed varies. Simple tools like Excel handle small datasets in seconds. Enterprise-grade systems such as Tableau or Power BI process terabytes of data in minutes using distributed computing. The faster the processing, the quicker teams can respond to changes in market conditions or operational issues.
Organizations use different analytic tools depending on their goals. The four primary categories are descriptive, diagnostic, predictive, and prescriptive analytics.
| Type | Purpose | Common Tools | Real-World Example |
|---|---|---|---|
| Descriptive | Summarizes past performance | Google Analytics, Power BI | A website tracks 12,000 monthly visitors and sees a 15% drop in May. The tool shows traffic came mostly from social media, prompting a review of ad campaigns. |
| Diagnostic | Explains why something happened | SQL queries, SAS | After a product launch, sales were low. A diagnostic tool traces the decline to poor targeting in email campaigns, revealing that the audience was mismatched to the offer. |
| Predictive | Forecasts future outcomes | Python with scikit-learn, IBM SPSS | A bank uses a predictive model to estimate loan default risk. Based on credit history and spending habits, it assigns each applicant a risk score, reducing bad debt by 22% over six months. |
| Prescriptive | Suggests optimal actions | Optimization engines, AI-driven platforms | A hospital uses a prescriptive tool to assign staff shifts. The system balances patient load, nurse availability, and overtime rules, improving coverage while cutting labor costs by 18%. |
Many tools combine multiple types. For example, a CRM platform may show current sales (descriptive), explain why deals dropped (diagnostic), forecast next quarter's revenue (predictive), and recommend follow-up strategies (prescriptive).
People often confuse analytic tools with data storage systems. A database holds records; an analytic tool interprets them. Storing 1 million customer records doesn't tell you which segment is most profitable-analytic tools do.
Another misconception is that analytic tools require advanced math. While statistical models underlie many features, most tools offer point-and-click interfaces. Users don't need to write code to run regression analyses or cluster customers. The complexity happens behind the scenes.
Businesses deploy analytic tools across departments. Marketing teams use them to evaluate campaign ROI. HR departments analyze employee turnover rates to improve retention. Operations managers track equipment downtime to reduce maintenance costs.
In public health, analysts used geographic mapping tools during the 2020 pandemic to visualize infection clusters. These tools helped allocate testing sites and medical supplies to high-risk areas. Data from 12 states was processed daily, revealing hotspots weeks before official reports.
Even individuals use analytic tools. A freelancer tracking income and expenses uses a tool like QuickBooks to generate monthly profit summaries. The dashboard highlights overspending in travel, prompting budget adjustments.
Analytics fails when divorced from context. A tool may show a 40% increase in app downloads-but without knowing the launch date, marketing spend, or regional rollout, the trend lacks meaning. The same spike could signal success or a bug causing unintended downloads.
One study by McKinsey found that 70% of failed analytics projects stemmed from misaligned objectives, not flawed tools. Teams often chose useful software without defining clear questions. The result: complex dashboards with no practical use.
I once worked with a nonprofit that implemented a reporting dashboard showing donor engagement. The tool tracked emails sent, donations received, and event attendance. But after three months, staff ignored it. We discovered the dashboard didn't align with how teams actually made decisions. Rebuilding it around weekly planning meetings increased usage by 60%.
What are analytic tools? They are systems that turn data into decisions. They don't replace judgment-they sharpen it. Whether used in a startup or a government agency, their value lies in clarity, speed, and consistency. When applied correctly, they deliver measurable improvements in efficiency, accuracy, and strategy.