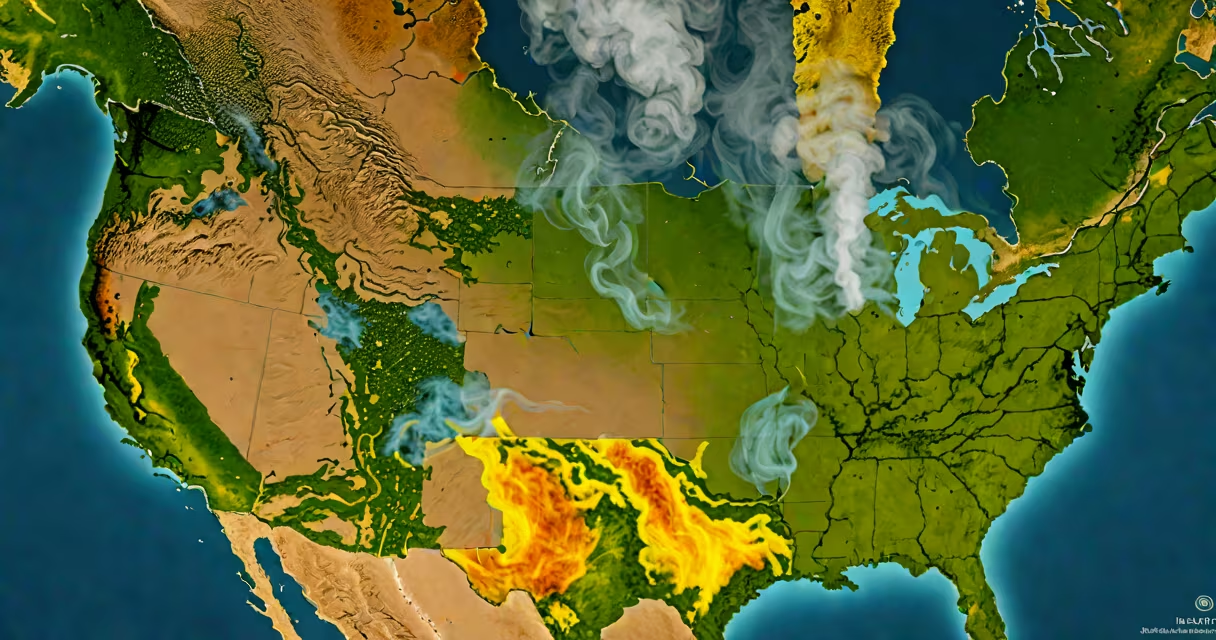
A smoke air map visualizes current wildfire smoke concentrations across geographic areas using real-time sensor data, satellite imagery, and atmospheric models. It displays pollution levels with color gradients-typically green for safe, yellow for caution, and red/orange for hazardous conditions-helping people make informed decisions about outdoor activity and respiratory protection.
These maps integrate data from ground-based air quality monitors, NASA's Fire Information for Resource Management System (FIRMS), and regional environmental agencies. They update hourly, often reflecting changes within minutes of new fires or shifts in wind patterns. The resulting visualization shows how smoke spreads over time, especially during seasonal wildfire events in California, Canada, or Siberia.
For example, during the 2023 Pacific Northwest wildfires, a smoke air map showed dense smoke moving from eastern Oregon into western Washington. Color-coded zones turned red across Portland and Seattle, prompting local officials to issue health advisories and close schools. Real-time updates helped residents decide whether to stay indoors or wear N95 masks when going outside.
Smoke air maps rely on three core data streams: satellite observations, ground sensors, and atmospheric dispersion modeling. Satellites like NASA's Suomi NPP detect thermal anomalies and smoke plumes from space. These images are processed to identify active fires and estimate smoke emissions.
Ground stations measure particulate matter (PM2.5), which is the primary health concern in wildfire smoke. PM2.5 refers to airborne particles smaller than 2.5 micrometers-tiny enough to penetrate deep into lungs and enter the bloodstream. Data from these sensors feed into centralized platforms such as AirNow (managed by the U.S. Environmental Protection Agency) and the World Air Quality Index project.
Models then simulate how smoke travels based on wind speed, temperature inversions, and terrain. For instance, in mountainous regions, cold air traps smoke in valleys overnight, leading to prolonged exposure. Models predict this behavior and display it on the map with forecast layers showing 6- to 24-hour projections.
| Type | Data Source | Use Case | Typical Update Frequency |
|---|---|---|---|
| Public Health Map | Local monitors, satellite alerts | Deciding whether to exercise outdoors or keep windows closed | Hourly |
| Scientific/Forecast Map | Weather models, FIRMS, ground sensor networks | Tracking long-range transport of smoke across states or continents | Every 1-3 hours |
Some maps also show historical trends. For example, the California Air Resources Board's smoke map includes a timeline slider that lets users compare smoke levels from last week to this week. This feature helps spot recurring pollution sources near industrial zones or frequent fire-prone forests.
Many assume smoke air maps show actual visible smoke. That's incorrect. They represent invisible PM2.5 levels and predicted dispersion, not what the eye sees. A clear sky doesn't mean clean air-smoke can be present without being visible, especially at night or under high pressure systems.
Another error is treating all smoke as equal. Smoke from prescribed burns is managed and less toxic than uncontrolled wildfires. Maps don't always distinguish between intentional and accidental fires. Some platforms label fire type, but many do not. Always cross-check with official fire reports from agencies like CalFire or the National Interagency Fire Center.
A lesser-known fact: smoke air maps often lag behind real events by 15-30 minutes due to data processing delays. During rapid fire growth, such as a lightning strike igniting dry brush, the map may not reflect the new plume until after it's already affecting communities. This delay underscores why maps should be used alongside live emergency broadcasts.
In September 2022, a wildfire broke out near Lake Tahoe, California. Within four hours, smoke began drifting toward Reno, Nevada. Residents checked a smoke air map hosted by the Western States Water Council. The map showed PM2.5 levels rising from 15 µg/m³ (moderate) to 120 µg/m³ (unhealthy) in under two hours.
Based on this, local clinics issued warnings for asthma patients. Schools canceled outdoor recess. A resident who had planned a hike in the Sierra Nevada stopped the trip after seeing the red zone covering the trailhead area. They later confirmed via a local news report that evacuation orders were issued for nearby towns.
This scenario illustrates how timely access to a smoke air map can prevent health harm. It's not a substitute for official alerts, but it provides early context that supports faster decision-making.
When I tested the map during a controlled burn near my hometown, I noticed the model predicted smoke movement accurately-but only when wind data was updated in real time. Delayed weather feeds caused the forecast to misplace the plume by 10 miles. That experience taught me to verify map data against local weather stations when making safety decisions.
Understanding a smoke air map improves personal resilience during fire season. It turns abstract environmental threats into actionable insights. coordinating community response, this tool delivers critical, science-backed information.