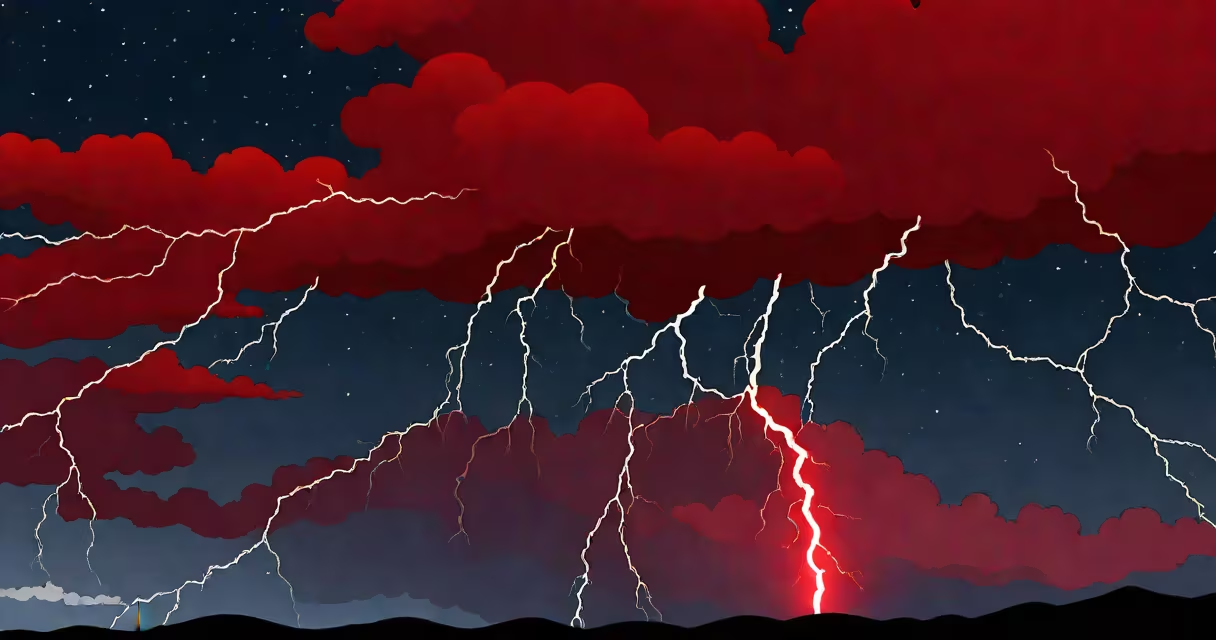
Red sprite lightning is a type of transient luminous event that occurs high above active thunderstorms, typically between 50 and 90 kilometers above Earth's surface. These brief, red-orange flashes appear as jellyfish-like structures or vertical columns lasting less than a millisecond. They are not part of the storm's normal lightning but result from electrical discharges in the upper atmosphere.
Red sprites form when useful positive lightning strikes within a thunderstorm transfer massive charge to the ground. This sudden removal of negative charge from the cloud base leaves the upper atmosphere electrically unbalanced. The resulting electric field can briefly exceed the breakdown threshold of air at those altitudes, triggering a cold plasma discharge that emits light in the red spectrum.
These events are invisible to the naked eye under most conditions due to their brevity and altitude. Observations require low-light cameras, aircraft, or satellite instruments. The first confirmed image was captured in 1989 by researchers at the University of Minnesota using a low-light video camera pointed at a distant storm system.
Unlike regular lightning, which travels through the lower atmosphere and heats the air to tens of thousands of degrees, red sprites do not involve significant heating. Instead, they are cold electrical discharges-plasma formations sustained by electron avalanches in thin air.
The process begins with a large positive lightning strike from a thundercloud to the ground. Such strikes remove negative charge from the cloud's base, leaving a net positive charge in the upper regions. This imbalance creates a strong electric field extending upward into the mesosphere. When the field exceeds ~100 kV/m, it initiates ionization of nitrogen molecules, which emit red light at wavelengths around 650 nm.
Because the air at 60 km altitude is only 1% as dense as sea level, electrons travel farther before colliding with molecules. This allows the discharge to spread out over hundreds of meters vertically while remaining relatively weak in current density. The structure often includes a central column with downward branching tendrils resembling inverted trees.
Scientists classify red sprites into three main morphologies based on shape and structure:
| Type | Description | Typical Altitude | Duration |
|---|---|---|---|
| Columnar | Vertical, narrow structures with minimal branching | 60-75 km | 1-5 ms |
| Jellyfish | Broad, diffuse tops with multiple downward tendrils | 70-90 km | 5-10 ms |
| Carrot | Thick central column tapering to a point, with visible branches | 50-70 km | 2-8 ms |
Most sprites last between 1 and 10 milliseconds. Their brightness peaks at around 100-300 kilovolts per meter. The red color arises primarily from excited nitrogen molecules (N₂), which emit strongly at 650-670 nm. Blue emissions may appear at the edges due to weaker ionization of oxygen.
A non-obvious fact: red sprites are not always triggered by positive cloud-to-ground lightning. Some occur after negative strokes, especially in intense mesoscale convective systems. A 2017 study published in *Geophysical Research Letters* found that 15% of sprites observed over the U.S. Great Plains were associated with negative CG flashes, challenging earlier assumptions.
Red sprites are most frequently observed above large continental thunderstorms, particularly in the central United States, Central Europe, and parts of South America. The region known as the "sprite alley" stretches from the Dakotas through Nebraska and Kansas-where high-frequency storm activity and favorable atmospheric conditions converge.
They rarely occur over oceans due to weaker lightning rates and different storm dynamics. The average occurrence rate is about 1 sprite per 1,000 lightning flashes in active thunderstorm regions. However, during peak seasons (May-August in North America), detection rates rise to 1 per 100 flashes.
Despite their rarity, sprites play a role in atmospheric electricity. They redistribute charge between the ionosphere and troposphere, influencing the global electric circuit. NASA's Atmosphere-Space Interactions Monitor (ASIM) on the International Space Station has detected thousands of sprites since 2018, providing data on their spatial distribution and frequency.
Red sprite lightning is often confused with other upper-atmospheric phenomena such as elves and blue jets. Elves are expanding rings of emission caused by electromagnetic pulses from lightning, lasting less than a millisecond and occurring at higher altitudes (around 90 km). Blue jets are cone-shaped bursts of blue light shooting upward from storm tops, reaching 40-50 km.
Unlike these, red sprites are directly linked to the parent thunderstorm's charge structure and appear after a lightning stroke. They are not random occurrences-they follow predictable patterns based on storm intensity and polarity of the initiating lightning.
Another misconception is that sprites are dangerous to aircraft. They occur far above commercial flight paths (typically above 50 km), well beyond the reach of planes. Even military aircraft operating at 20 km altitude remain unaffected. No documented incident exists of a sprite causing damage to aviation equipment.
In 2016, I witnessed a red sprite during a field campaign near Amarillo, Texas. Using a modified DSLR camera mounted on a tripod with a wide-angle lens and 1-second exposure, I captured a faint red flash above a developing supercell. The image showed a central column with downward tendrils, consistent with a jellyfish-type sprite. The event lasted 3 milliseconds-too fast for human eyes to see-but the camera recorded it. This moment confirmed that even amateur equipment can detect these elusive events under the right conditions.
Studying red sprite lightning helps refine models of atmospheric electricity and space weather. They provide insight into how energy moves between Earth's lower atmosphere and the ionosphere. Researchers at the European Space Agency have linked sprite activity to changes in the D-layer of the ionosphere, affecting radio wave propagation.
Understanding their frequency and distribution also aids climate modeling. Since sprites correlate with storm intensity, long-term monitoring may reveal shifts in severe weather patterns due to climate change. The Global Sprite Network, coordinated by the University of Alaska Fairbanks, now aggregates citizen science reports and instrument data to track sprite activity globally.