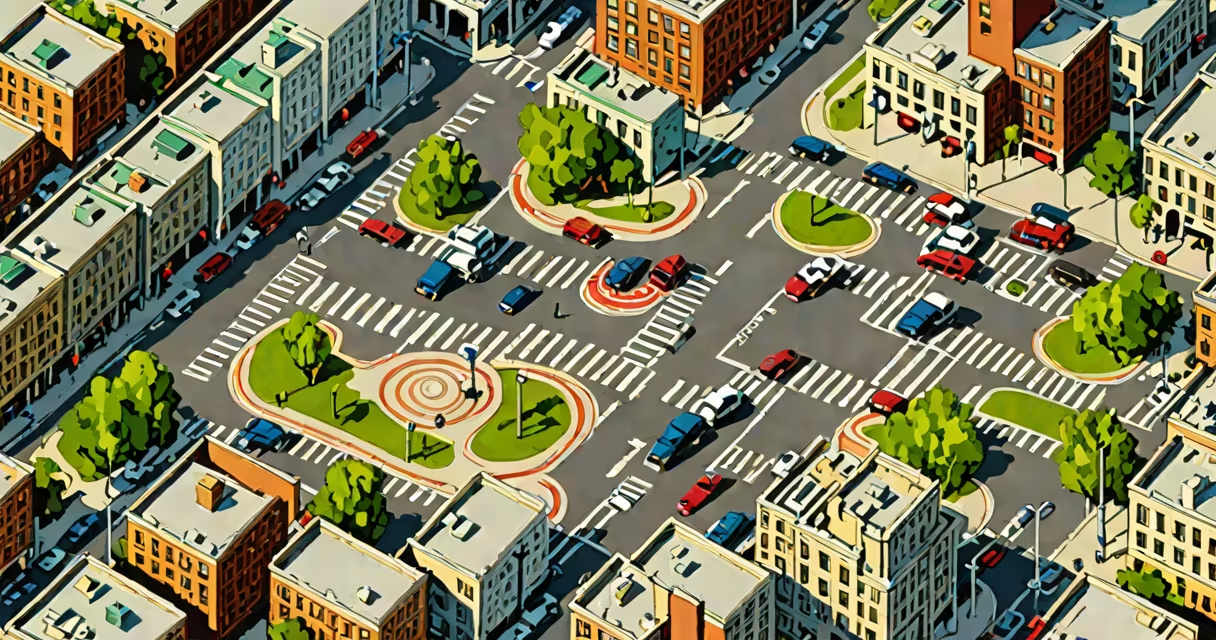
Grid lock occurs when a network of intersecting streets becomes fully blocked by stationary vehicles, halting all movement in all directions. This happens when traffic volume exceeds road capacity, especially during peak hours or after incidents like accidents or construction.
Grid lock is not a single event but a systemic failure in traffic flow. It typically forms at intersections where multiple roads converge, such as downtown cores or major arterial crossings. Once vehicles stop, they block access for others, creating a feedback loop that worsens congestion. The term originated in urban traffic studies during the 1960s, describing the visual and functional collapse of street networks under high demand.
According to the Federal Highway Administration (FHWA), grid lock events account for nearly 15% of all urban traffic delays in U.S. metropolitan areas with populations over 1 million. A 2022 study by the Texas A&M Transportation Institute found that grid lock contributes to an average of 18 hours of delay per commuter annually in cities like Los Angeles and New York.
Grid lock develops through a chain reaction triggered by oversaturated intersections. When too many vehicles arrive at a crossroad simultaneously, merging lanes fail to accommodate incoming traffic. Drivers stop to wait for gaps, which then reduce the effective throughput of the intersection. As more cars pile up, they block adjacent roads, turning a local bottleneck into a citywide issue.
For example, during morning rush hour in Chicago's Loop district, a single accident on State Street caused a cascade of stops. Within 12 minutes, five major intersections became gridlocked. Vehicles on Clark Street, Wacker Drive, and Michigan Avenue were unable to move, despite clear visibility and functioning traffic signals. Emergency services reported that 23 emergency vehicles were delayed by over 30 minutes trying to reach the scene.
The process is governed by queuing theory in transportation engineering. When arrival rate exceeds service rate (i.e., the number of vehicles that can pass through an intersection per minute), queues grow exponentially. Once queue length reaches the physical limit of the roadway, grid lock occurs. This threshold varies by city, but research shows that most urban centers operate near or above capacity between 7:30 AM and 9:00 AM daily.
Several interrelated factors contribute to grid lock formation:
A 2021 report from the National Institute of Standards and Technology (NIST) identified signal coordination as the most impactful variable. Cities using adaptive traffic signal systems-such as SCATS (Sydney Coordinated Adaptive Traffic System)-reduce grid lock occurrences by up to 40% compared to fixed-timing systems.
One non-obvious factor is the "phantom traffic jam." These occur without visible cause and result from small driver reactions amplifying over time. A single brake in a long line of vehicles can trigger a wave of stops that propagates backward, eventually blocking entire grids. Researchers at MIT's Senseable City Lab demonstrated this effect using simulation models showing grid lock forming within 8 minutes of a single driver braking at 55 mph.
Grid lock is often mistaken for general traffic congestion. While both involve slow or halted movement, congestion is a state of reduced speed, whereas grid lock is a complete standstill. A road may be congested with vehicles moving at 5 mph, but it is only grid locked when no vehicle can proceed in any direction.
Another misconception is that grid lock only affects large cities. In reality, smaller towns with poorly designed junctions-like those with narrow roundabouts or missing turn lanes-experience grid lock during festivals or school drop-off times. For instance, in 2023, the town of Millville, Vermont, saw a grid lock during a fall harvest festival. With 1,200 visitors arriving in 90 minutes, the main intersection backed up for 1.3 miles, trapping emergency responders and delivery trucks.
Some assume grid lock is purely a mechanical problem. But behavioral patterns play a major role. A 2020 study published in *Transportation Research Part C* showed that drivers who frequently change lanes increase the likelihood of grid lock by 27% compared to consistent lane-keepers. This is because erratic maneuvers disrupt flow stability and create micro-stops.
Cities use several methods to avoid grid lock. Adaptive signal control adjusts light cycles based on real-time traffic data. In Seattle, the implementation of the SCATS system reduced average delay times by 34% across 120 intersections. Sensors embedded in pavement detect vehicle presence and adjust green light duration dynamically.
Urban planners also redesign road layouts to reduce conflict points. The addition of dedicated turn lanes, bypass routes, and grade-separated intersections (like flyovers) minimizes the chance of grid lock. In Singapore, the government mandates that all new developments include traffic impact assessments to ensure proposed layouts won't exceed capacity thresholds.
During events, temporary measures like contraflow lanes (reversing traffic direction on certain roads) have proven effective. After a power outage in Atlanta in 2022, city officials rerouted buses and emergency vehicles via a 3-mile contraflow corridor, preventing grid lock in downtown areas.
As someone who once spent 45 minutes stuck in a grid lock during a snowstorm in Denver, I learned firsthand how quickly calm turns to frustration. The experience underscored the importance of proactive traffic management-not just reactive fixes.
Understanding how grid lock differs from related phenomena improves response accuracy. The table below outlines key distinctions:
| State | Definition | Vehicle Movement | Example |
|---|---|---|---|
| Grid lock | Complete halt in all directions at an intersection | Zero forward motion | Five lanes blocked during a festival in Austin |
| Severe congestion | Very slow speeds due to high volume | 1-10 mph | Interstate 5 in LA during holidays |
| Flow breakdown | Smooth flow collapses into stop-start waves | Alternating stops and starts | Backups on I-95 in Baltimore |
| Queueing | Waiting line forms at a signal or ramp | Stopped or crawling | Long line at a toll booth |
Recognizing these differences helps emergency crews and city planners respond appropriately. For example, grid lock requires immediate traffic redirection, while congestion may only need signal optimization.
When grid lock occurs, the solution is not simply waiting. Instead, coordinated intervention-such as deploying traffic officers, activating alternate routing apps, or adjusting signal priorities-is essential. The city of Oslo uses AI-driven traffic monitoring to detect grid lock conditions within 4 minutes of onset and automatically reroutes public transit and emergency vehicles.