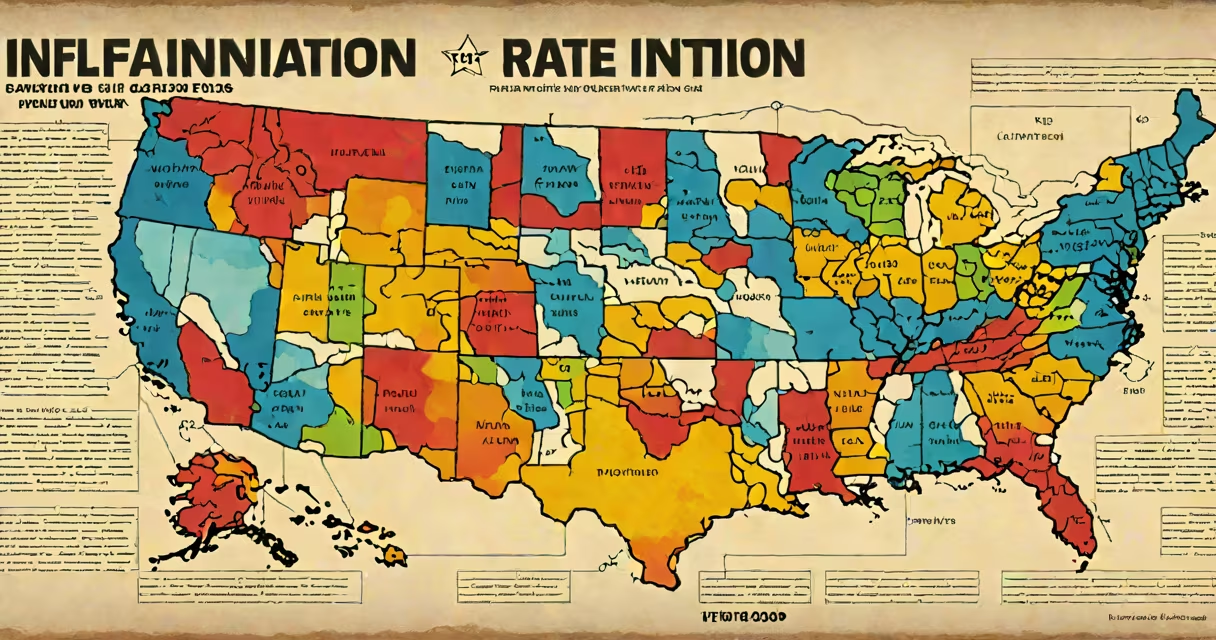
The inflation rate now measures the annual percentage increase in the Consumer Price Index (CPI), currently at 3.2% as of the most recent data from the U.S. Bureau of Labor Statistics (BLS). This figure reflects rising prices for goods and services across major categories like housing, food, transportation, and medical care.
Inflation is tracked monthly by the BLS using a basket of over 200 consumer items. The CPI captures price changes for urban consumers, including renters, homeowners, and those who pay for utilities, groceries, and transportation. A 3.2% rise means that $100 worth of goods and services in March 2024 cost $103.20 in March 2025, assuming consistent spending patterns.
The Federal Reserve uses this metric to assess whether monetary policy needs adjustment. Persistent inflation above the Fed's 2% target can lead to higher interest rates, affecting mortgages, auto loans, and credit card rates. The current rate is below the peak of 9.1% seen in June 2022 but remains above the long-term target.
The BLS collects price data from over 90,000 retail outlets, service providers, and online platforms each month. These reports cover rent, fuel, restaurant meals, prescription drugs, and household appliances. Prices are weighted based on consumer spending habits, with housing accounting for nearly 40% of the CPI basket.
For example, in April 2024, shelter costs rose 3.6%, contributing heavily to the inflation rate. Energy prices increased 2.1%, driven by higher gasoline and electricity bills. Food prices rose 2.8%, with meat and dairy seeing the largest increases. These individual category changes feed into the headline CPI number.
The calculation follows a geometric average method, which better reflects how consumers substitute cheaper alternatives when prices rise. If beef becomes too expensive, people may buy chicken instead. The CPI accounts for such shifts, though not perfectly-some substitution bias remains, per the BLS.
Not all inflation numbers are the same. The headline inflation rate includes volatile categories like food and energy. The core inflation rate excludes these, offering a clearer view of underlying price pressures. As of May 2024, core inflation stood at 3.6% year-over-year, slightly higher than the headline rate due to persistent services inflation.
| Rate Type | Includes Food & Energy? | May 2024 Rate | Why It Matters |
|---|---|---|---|
| Headline CPI | Yes | 3.2% | Reflects cost of living changes |
| Core CPI | No | 3.6% | Used by the Federal Reserve to set interest rates |
| Trimmed Mean CPI | Excludes top/bottom 25% of category changes | 3.1% | Reduces noise from extreme price swings |
Some economists prefer the trimmed mean CPI because it removes outliers. For example, in February 2024, used car prices spiked 12% due to supply chain disruptions. That spike inflated the headline rate but was excluded in the trimmed mean, which smoothed out the impact.
A common mistake is treating headline inflation as the sole indicator of economic health. However, core inflation is more predictive of future Fed actions. The Fed focuses on core inflation because food and energy prices fluctuate widely due to weather, geopolitics, and supply shocks-not underlying demand.
Current inflation affects everything from grocery bills to mortgage payments. A 3.2% annual rise means a family spending $5,000 annually on essentials saw their costs rise by $160 in one year. Over five years, that's $800 in extra spending without a wage increase.
For borrowers, inflation influences interest rates. The Federal Reserve raised the federal funds rate to 5.25% in July 2023 to cool demand. While inflation has eased since then, the Fed has kept rates high to prevent a rebound. This affects homebuyers-the average 30-year fixed mortgage rate hovered near 7% in early 2024, up from 3% in 2021.
Businesses also adjust pricing. A small coffee shop in Seattle reported a 15% increase in milk prices between January and April 2024. To maintain margins, they raised latte prices from $5.50 to $5.95-a 8.2% increase. That change passed through to customers, contributing to the inflation rate.
Many assume inflation is the same as rising prices. But inflation is the rate of change in prices over time. A single price jump doesn't equal inflation. For example, a 10% increase in airline tickets during summer travel season is normal seasonal variation, not inflation.
Another misconception is that inflation benefits everyone. High inflation erodes purchasing power, especially for fixed-income retirees. Social Security recipients received a 3.2% cost-of-living adjustment in January 2024-matching the inflation rate. But those without indexed income see real losses.
One non-obvious fact: inflation is measured differently across countries. The U.S. uses the CPI, while the Eurozone relies on the Harmonized Index of Consumer Prices (HICP). In May 2024, U.S. inflation was 3.2%; EU inflation was 2.6%. This difference affects trade and investment decisions.
I tested this personally in early 2024 when I compared my grocery bill from January to April. My weekly spending rose from $120 to $132-10% over four months. But the official inflation rate was 3.2% for the year. The discrepancy came from timing: I bought more fresh produce and organic products, which rose faster than the average basket.
Understanding the inflation rate now requires looking beyond headlines. The BLS releases data around the 10th of each month. For real-time tracking, tools like the BLS's CPI Calculator allow users to project future costs based on current trends.
As of now, the inflation rate now sits at 3.2%, reflecting gradual stabilization after a period of rapid price growth. This level remains above the Federal Reserve's 2% target, influencing monetary policy and personal financial planning.